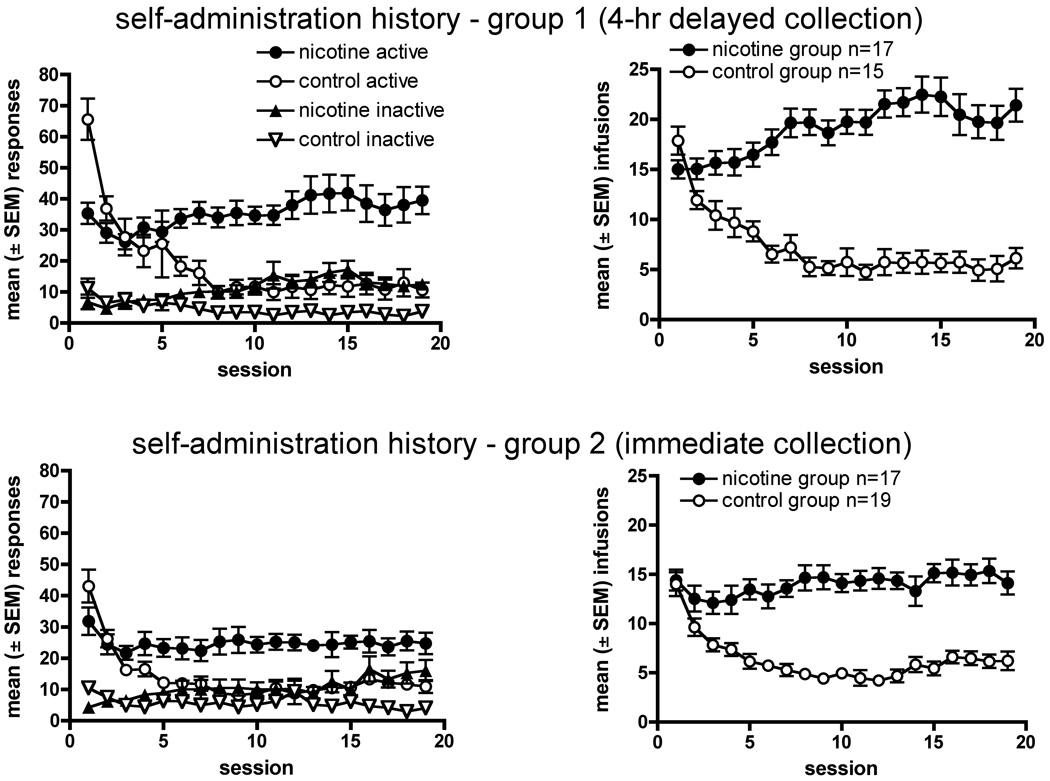
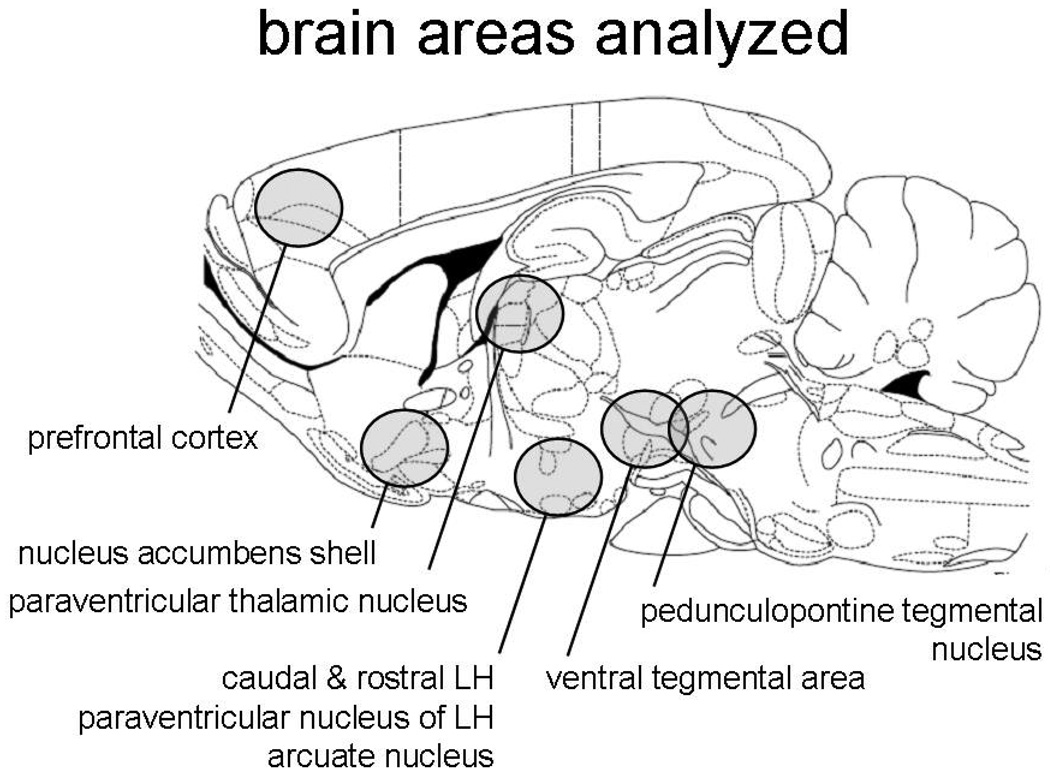
Fig 2.
(a) The 4 panels show the NSA data over 19-day periods for the 2 groups of animals used in the gene expression studies. Left-hand panels for each group show the total number of lever presses. The right-hand panels show the number of nicotine infusions obtained. The top two panels show data from the group in which brain tissue was collected 5 hr after the last NSA session, while the bottom two panels show data from the group in which tissue was collected immediately (1–11 min) after the final session. (b) Schematic shows the brain regions that were collected by micro-dissection in group 1.


