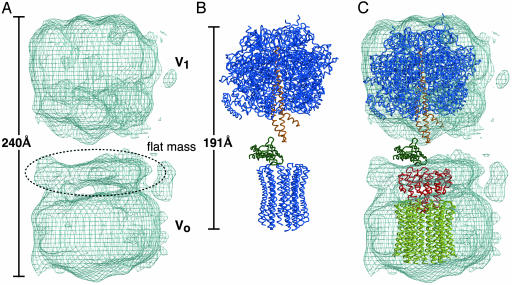
Fig. 3.
The structure of the holo V-ATPase compared with the F-ATPase. (A) The V-ATPase structure by single particle analysis using electron microscopy. (B) X-ray structure of F1c10-ATPase from yeast (PDB ID 1QO1). Central stalk subunits γ and ε are highlighted in orange and green, respectively, whereas the other subunits (α3,β3,ε,c10) are colored in blue. (C) Superimposition of subunit C (red) with the modeled rotor ring (yellow). Yeast F1-ATPase (α3,β3,γ,ε) is also fitted to the Vo domain as a reference. The color scheme of the F1-ATPase is the same as in B.

