
. 2011 Jun 25;11:151. doi: 10.1186/1472-6963-11-151
Copyright ©2011 Cotté and De Pouvourville; licensee BioMed Central Ltd.
This is an Open Access article distributed under the terms of the Creative Commons Attribution License (http://creativecommons.org/licenses/by/2.0), which permits unrestricted use, distribution, and reproduction in any medium, provided the original work is properly cited.
Figure 2.
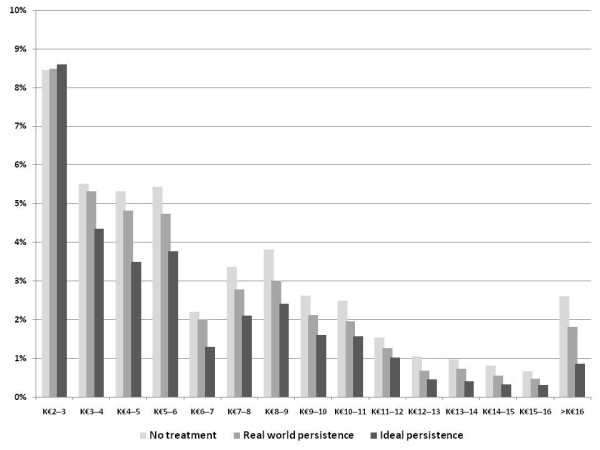
Distribution of 10-year fracture cost management.