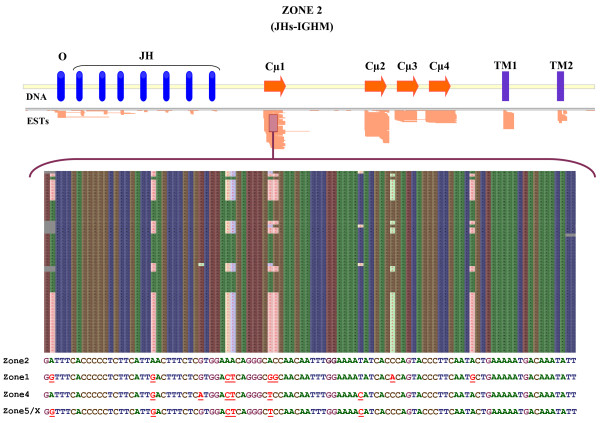
Figure 5.
Confirmation of different genomic zones through ESTs alignment. The top part of the figure shows the result obtained after aligning medaka immunoglobulin coding ESTs with the region of zone 2 that presents JH segments and the IGHM gene. A higher number of ESTs matches with Cμ1 and Cμ2 is due to their presence in transmembrane and secreted IgM. The bottom part shows details of ESTs alignment with the Cμ1. It includes the specific nucleotide sequence to each zone. Identical nucleotides are shown in the same colour (A: green, C: brown, G: lilac, T: blue) and differences are in red and underlined.

