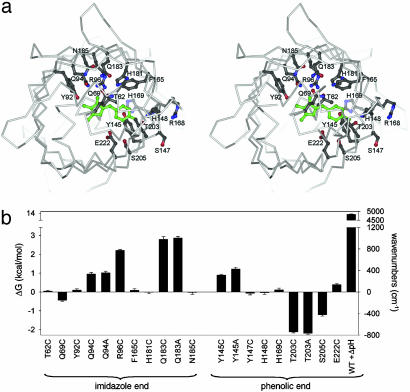
Fig. 1.
Energetic characterization of the GFP chromophore-binding pocket. (a) Stereoview of the binding pocket viewed down the β-barrel axis showing sites included in the mutagenic scan. The p-hydroxybenzylideneimidazolin-one chromophore is shown in green. (b) Mutagenic scan of the chromophore environment including the perturbation of pH shift from 8.5 to 5.5 (ΔpH). The energetic effect of each mutation is measured as change in chromophore absorbance maximum, a property that derives from changes to the ground state structure of GFP (24). Mutation of some sites has no significant energetic effect despite direct interaction with the chromophore (H148C), whereas the largest effect is seen for Q183, which only indirectly contacts the chromophore. This and subsequent figures were prepared by using gl-render (L. Esser, personal communication), povray (34), and raster3d (35).

