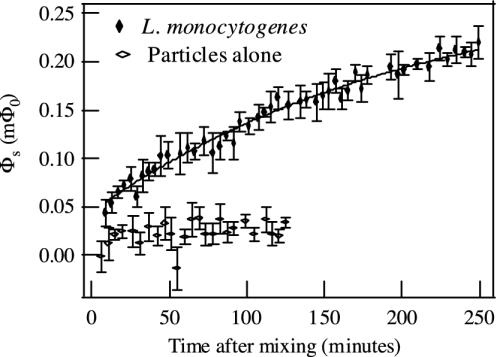
Fig. 6.
Binding rate measurement. L. monocytogenes (concentration, 2.5 × 10⁸ per ml) and particle–antibody complexes (concentration, 0.05 relative to the stock particle suspension) were mixed together, and the magnetic relaxation signal was measured as a function of time. Each decay curve was fit to a combination of logarithmic and exponential functions; the logarithmic amplitudes are shown. The amplitude vs. time data were fit to Φ(t) = Φoffset + Φexp[1 – exp(–t/τ)]. As a control, the signal from particle–antibody complexes alone (concentration, 0.05 relative to the stock particle suspension) was measured over time.

