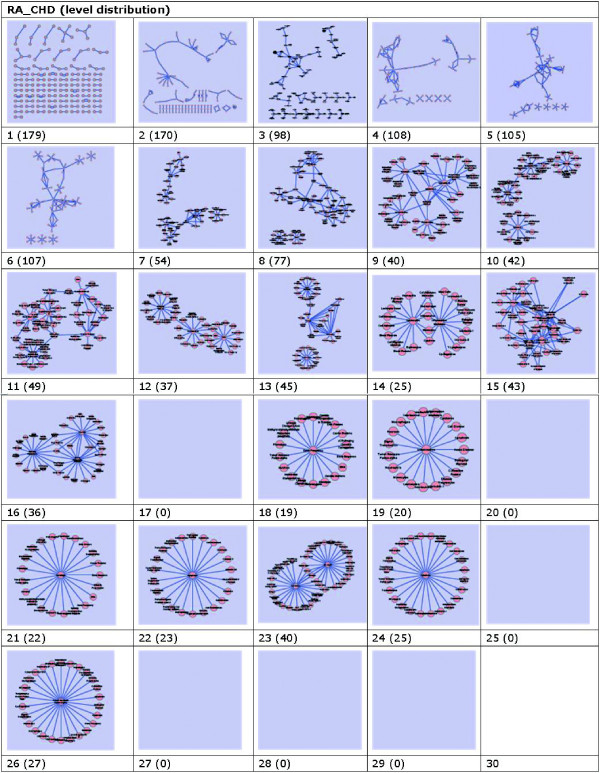
Figure 7.

Graphics of data slices on level distribution based on frequency with nodes in parenthesis. These networks are constructed with data set downloaded from PubMed on May 9, 2010. They are built under the conditions that for a network on frequency i (i = 1, 2, 3,···, 30) which are in Fig. 7. We calculate the data slice slicei with formula slicei - slicei+1 with i ≤ 29.
