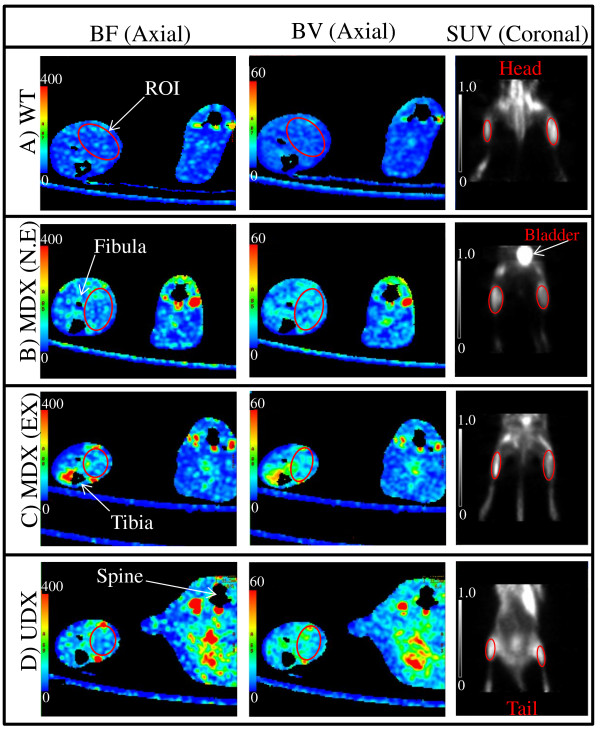
Figure 1.
DCE-CT image (a), Blood flow (b), Blood volume (c) and FDG-PET image (d) of a mdx mouse at 8 weeks of age. Axial slices using DCE-CT of the lower limbs of a dystrophic mouse (a,b,c); coronal slice generated using PET, displaying the mdx mouse from the abdomen to the feet (d). Red circles indicate one region of interest (ROI) encompassing the posterior compartment of the hind limb (HL) musculature from which data was collected.

