
Figure 8.
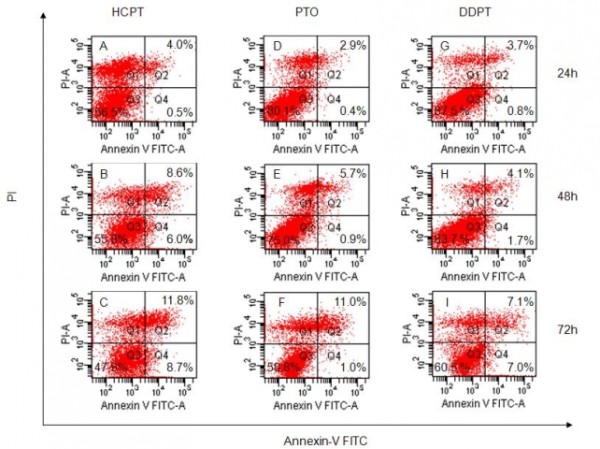
Flow cytometry analysis for apoptosis inducing activities of PTO and DDPT on PC3 cells. The appearance of apoptosis cells was detected by flow cytometry using Annexin V/PI staining. In the figure, A, B and C: treated with HCPT (20 μM) for 24, 48 and72 h; D, E and F: treated with PTO (20 μM) for 24, 48 and 72 h; G, H and I: treated with DDPT (20 μM) for 24, 48 and 72 h.