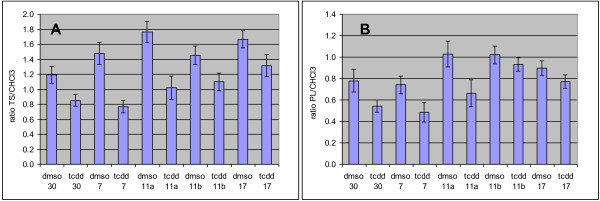
Figure 2.
Ratios between the intensity of some NMR spectral signals. A: Ratio between the intensity of the total NMR spectral signals (TS) and the intensity of the residual CHCl3 signal. B: Ratio between the intensity of the phospholipid signal in the NMR spectra (PL) and the intensity of the residual CHCl3 signal.

