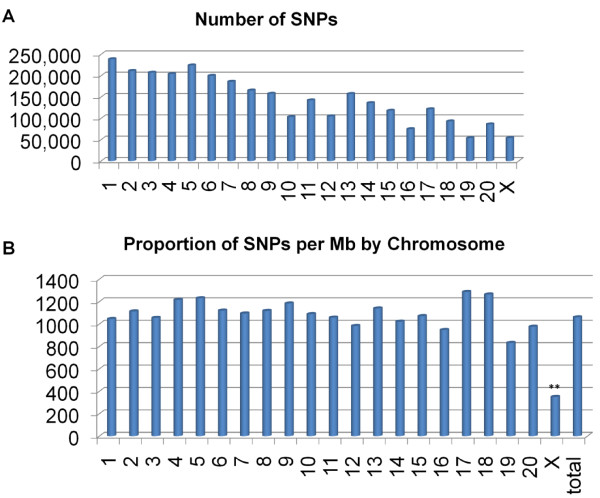
Figure 2.
Genomic distribution of SNPs. (A) The total number of SNPs identified in each chromosome. (B) The second bar graph shows the relative concentrations of SNPs validated in SNPs/Mb by chromosome. Only chromosome X (**) displays a SNP concentration that deviates more than one standard deviation unit (195.3 SNPs/Mb) from the mean (1057.1 SNPs/Mb).

