Figure 1.
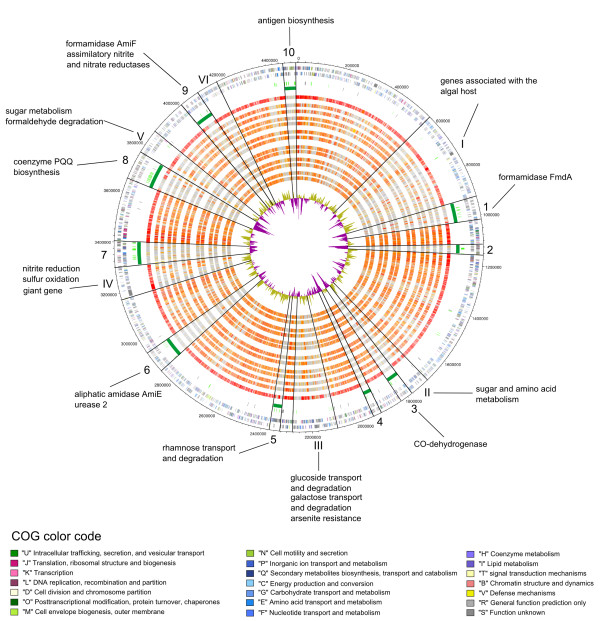
Circular plot of the chromosome of R. litoralis. Rings from the outside to the inside: 1 and 2: open reading frames (ORFs) on the leading strand and on the complementary strand, respectively. Colours according to Clusters of Orthologous Groups (COG) -categories. 3: rRNA cluster (pink); 4: transposases (light green) and tRNAs (black); 5: genomic islands (dark green); 6-18: orthologous ORFs according to the Needleman-Wunsch-algorithm in the following organisms in the order of appearance: Roseobacter denitrificans OCh114, Oceanibulbus indoliflex HEL-45, Sulfitobacter NAS-14.1, Dinoroseobacter shibae DFL-12, Jannaschia sp. CCS1, Phaeobacter gallaeciensis DSM17395, Ruegeria pomeroyi DSS-3, Roseovarius nubinhibens ISM, Roseobacter AzwK-3b, Octadecabacter arcticus 238, Loktanella vestfoldensis SKA53, Maritimibacter alkaliphilus HTCC2654, Rhodobacterales bacterium HTCC2150. Two organisms were chosen of each phylogenetic group outlined by Newton et al. [7]. The shade of red illustrates the value of the algorithm with red bars representing the ORFs with the best conformity to the respective ORFs of R. litoralis and the grey bars showing the ORFs that have no orthologs in the respective organism. 19: G+C-content of the chromosome of R. litoralis with violet areas below average and olive areas above average. Genomic islands (GEIs, labelled with Arabic numerals) and hypervariable regions (HVRs, labelled with Roman numerals) are separated by black lines. Special features within the GEIs and HVRs are outlined and are further discussed in the text.

