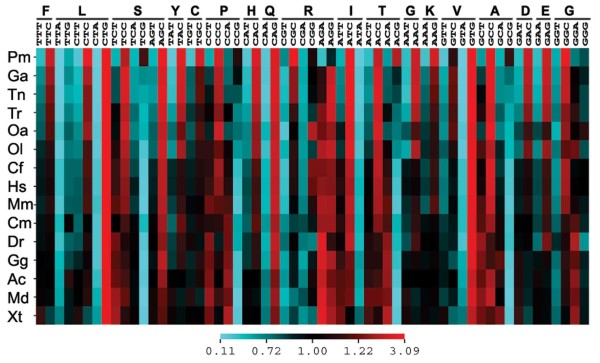
Figure 7.
Heat map of RSCU values for 15 vertebrate species. Each column represents a codon, and each row represents a species. Sequence datasets employed are the same as those in Figure 6D-F. Frequencies of each synonymous codon are indicated by the colour in the relevant grid. Species are sorted according to their genome-wide GC3 values, and their names are abbreviated as in Figure 5.

