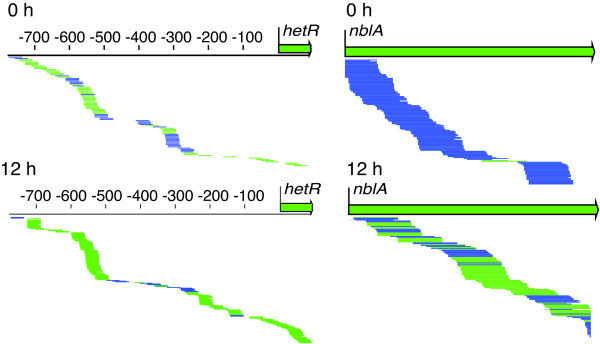
Figure 4.
Examples of antisense RNAs. RNA-seq reads for 0 and 12 h time points are shown underneath the ORF or 5' UTR as single lines, with blue lines representing reads to the left and green lines representing reads to the right. For the 5' UTR of hetR (on left), the ratio of antisense (blue) to sense (green) reads was decreased at 12 h after nitrogen step-down. For nblA (on right), antisense reads in the coding region were dominant before nitrogen step-down; however, at 12 h, nblA sense reads were abundant and antisense reads were decreased.

