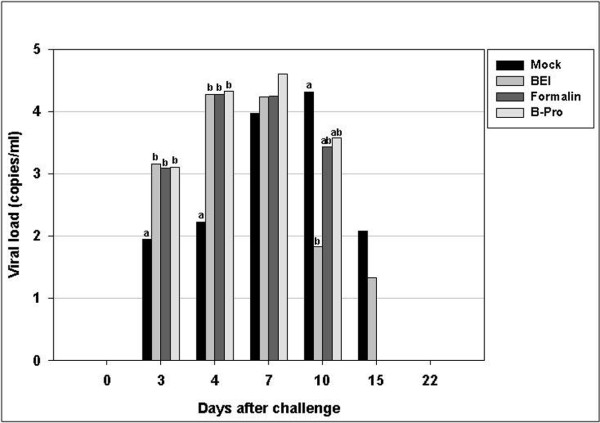
Figure 7.
PRRSV load in serum samples after challenge. The results were obtained by quantitative PCR and are expressed as copies/mL of serum. The 4 groups were challenged on day 70 after primary vaccination. Bars represent the average viral load at each time point. Values with superscripts in each experimental day are significantly different (p < 0.05).

