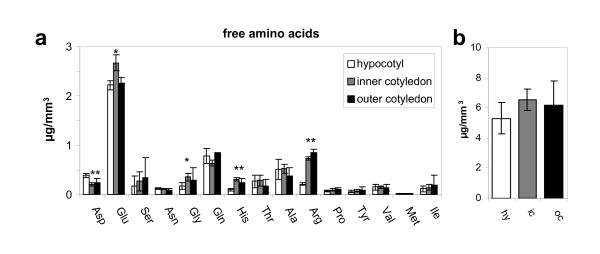
Figure 6.
Free amino acids in laser-microdissected tissues of B. napus measured by HPLC. (a) Comparison of single free amino acids per analysed sample of 5 elements per tissue (minimum tissue amount ~0.036 mm3). (b) Total amount of free amino acids calculated as the sum over all detected amino acids. Mean values +/- standard deviation are shown (n = 5). Stars indicate statistically significant differences versus hypocotyl according to t-test (p < 0.01). Abbreviations: hy-hypocotyl; in-inner cotyledon, oc-outer cotyledon

