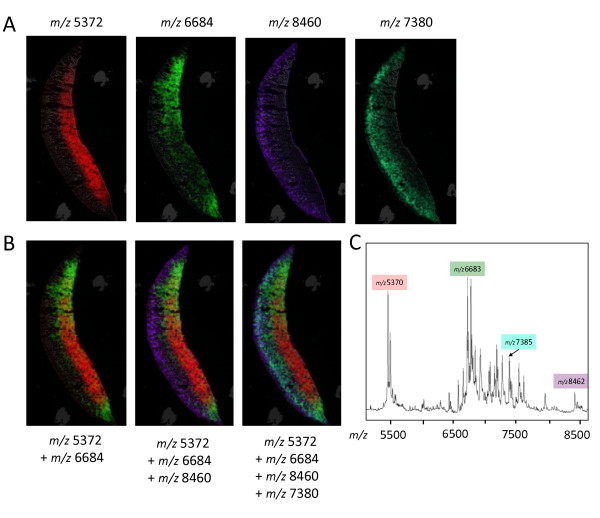
Figure 4.
MALDI-imaging in soybean cotyledons. (A) MALDI-MSI cross section of a soybean cotyledon. The localisation of 4 distinct m/z values is shown. (B) The individual peaks are overlayed in the same MALDI-MSI section. (C) The average mass spectrum of the cross section is shown highlighting the m/z values of interest.

