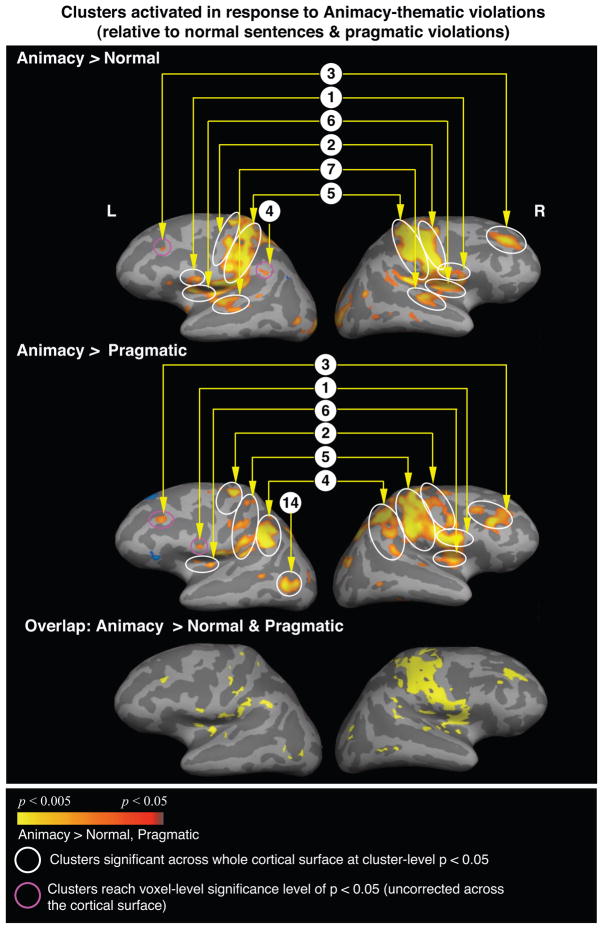
Figure 4.
Cortical statistical maps comparing responses to the animacy violations (modeled from the onset of the critical word until the onset of the “?”) with responses to the non-violated verbs (top row) and to the pragmatically violated verbs (middle row). Activation is displayed on an average lateral cortical surface with light gray indicating the gyri, and dark gray indicating the sulci. Yellow-red: more activity to the animacy violations than to the non-violated verbs or to the pragmatic violations. Blue: less activity to the animacy violations than to the non-violated verbs and the pragmatic violations. All clusters circled are significant at a cluster-level p < 0.05. Cluster numbers correspond directly to those regions reported in Table 6.
Bottom row: areas that showed overlap between the yellow-red clusters shown in the first two rows, i.e. regions that showed more activity to the animacy violations relative to both the non-violated verbs and the pragmatic violations.

