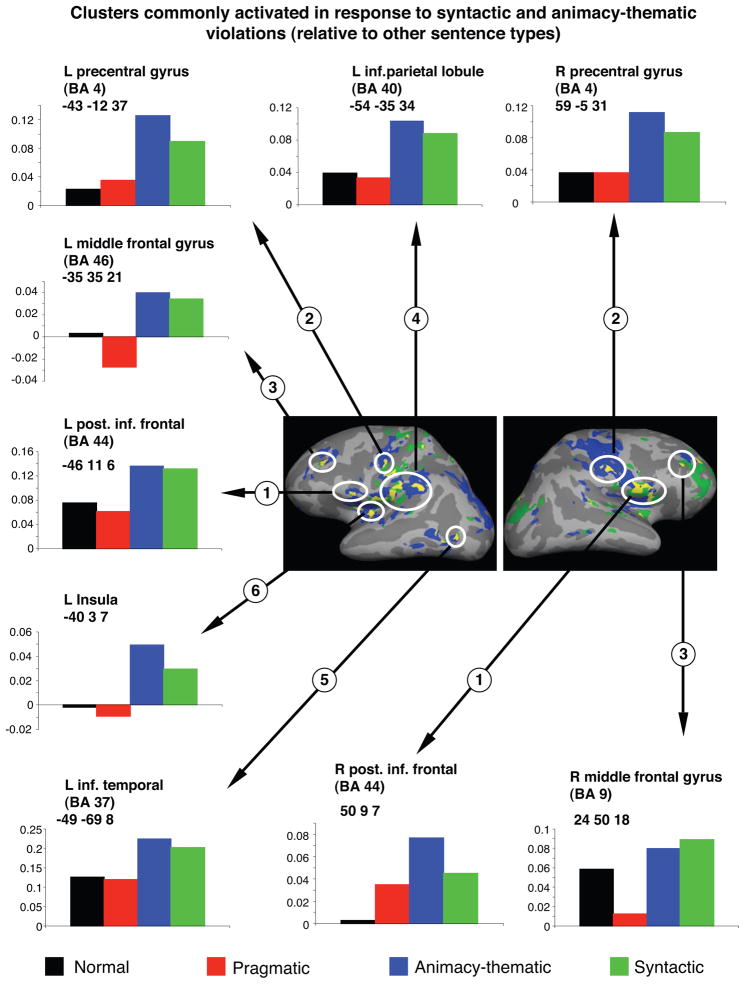
Figure 5.
The image illustrates cortical maps showing regions commonly activated by the syntactically violated and the animacy violated sentences (relative to the normal sentences and the pragmatically violated sentences). Green: regions of overlap that showed more activity to the syntactic violations relative to both non-violated verbs and pragmatically-violations (i.e. those shown in the bottom row of Figure 3). Blue: regions of overlap that showed more activity to the animacy violations relative to both non-violated verbs and pragmatic violations (i.e. those shown in the bottom row of Figure 4). Yellow: regions of overlap between those areas shown in blue and green. The hemodynamic time courses of activation for each of these yellow regions depicting overall overlap are shown. The numbers indicated correspond directly to the regions reported in Tables 5 and 6 and depicted in Figures 3 and 4. Talairach coordinates within of each of these regions is given. Brodmann Areas (BAs) are approximate.

