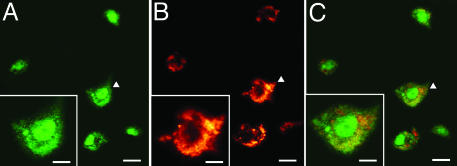
Fig. 3.
Colocalization of DNMT1mRNA and GAD65/67 in BA10 (layer I/II) of one SZP. (A) DNMT1 mRNA-positive neurons, color-coded in green. (Scale bar, 10 μm.) (B) GAD65/67 immunoreactivity, color-coded in red. (Scale bar, 10 μm.) (C) Overlay of A and B. (Scale bar, 10 μm.) At the bottom left of each panel is a large magnification of the cells indicated by arrowheads. (Scale bars, 5 μm.)

