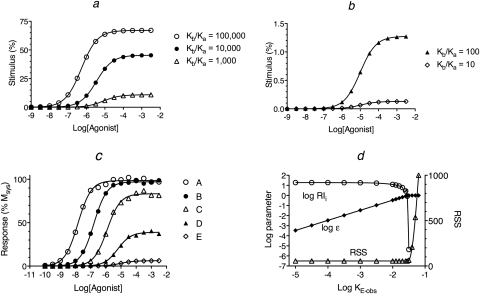
Fig. 3.
Analysis of simulated agonist concentration-response curves. Agonist concentration-response curves were generated by first calculating the stimulus (a and b) using eq. 30 under Appendix with the concentration of guanine nucleotide high (X = 1.0 mM). This stimulus was used as input to the operational model (eq. 1) to yield the response as a function of the agonist concentration (c). d, nonlinear regression analysis of the concentration-response curve of agonist A using eq. 4. The points show the estimates of log RIi, log ε, and the RSS plotted against the value to which KE-obs was constrained during regression analysis. A least-squares fit was obtained whenever log KE-obs ≤ −1.55. The affinity constants of the agonists (A–E) for the inactive state of the receptor were the same (Ka = 105 M−1). Those for the active state (Kb) were 1010, 109, 108, 107, and 106, respectively, as indicated by the Kb/Ka ratios in a and b. The microscopic state constants for the quaternary complex model were log Ke, −2.15; log Kg, 2.85; log Kk, 8.00; log Km, 4.60; and log Kc, −4.30. The ratio of G protein to receptor was 10, and the receptor concentration was 1.0 unit. The parameters of the operational model were Msys, 100; m, 1.0; and log KE, −1.7.

