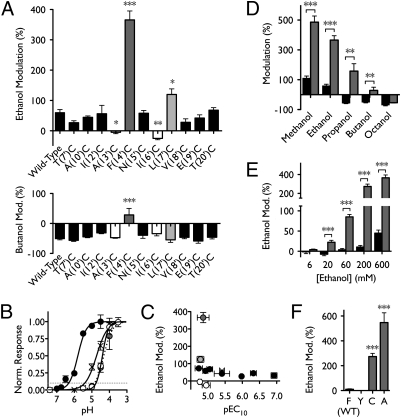
Fig. 3.
Effects of cysteine substitutions in M2 on n-alcohol modulation. (A) Modulation by 600 mM ethanol (Upper) or 11 mM butanol (Lower) of wild-type GLIC and 11 mutants. Channels exhibiting ethanol potentiation not significantly different from wild type are shown in black; mutants that ablated (13′, 16′; white) or enhanced (14′, 17′; gray) ethanol potentiation are colored independently (significance vs. wild-type, Dunnet's multiple comparison test, analysis of variance). (B) Sample pH response curves showing enhanced proton sensitivity of mutant A(10′)C (black circles) and reduced proton sensitivity of A(13′)C (white circles) and F(14′)C (gray circles, dotted curve) relative to wild type (crosses). Curves represent nonlinear regression fits as described in SI Methods. Dotted line represents 10% activation, at which alcohol modulation was measured. (C) Lack of correlation between changes in gating and ethanol potentiation for wild-type (crosses) and cysteine-substituted channels (circles) colored as in A. (D) Modulation of wild-type (black) and F(14′)C (gray) GLIC by a range of n-alcohols: 590 mM methanol, 600 mM ethanol, 86 mM propanol, 11 mM butanol, and 36 μM octanol. (E) Enhancement of potentiation in mutant F(14′)C (gray) relative to wild type (black) at a range of ethanol concentrations. In D and E, significance is vs. wild type, unpaired t test. (F) Potentiation by 200 mM ethanol of a variety of mutants substituted at position 14′ (significance vs. wild-type, Dunnet's multiple comparison test, analysis of variance). Errors are SEM, n = 2–17. *P < 0.05; **P < 0.01; ***P < 0.001.

