Fig. 5.
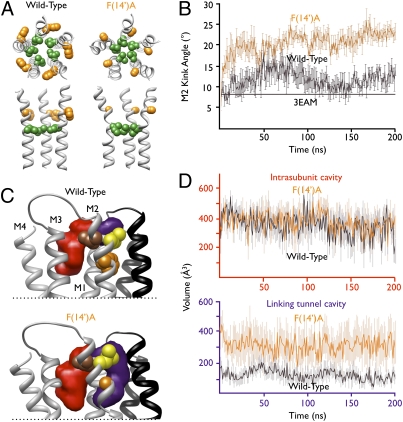
Structural correlates of GLIC alcohol potentiation. (A) Wild-type (Left) and F(14′)A (Right) GLIC after 200-ns molecular dynamics simulations. Upper: M2 helices viewed from the extracellular side with kink position 9′ (green) and ethanol-enhancing position 14′ (orange) as spheres. Lower: Equivalent residues in the M2 helices of three subunits viewed from the channel pore. (B) Measurement of M2 helix kink angle over the course of wild-type (black) and F(14′)A (orange) simulations. Solid black line represents kink angle in GLIC crystal structure. (C) Region of GLIC surrounding key M2 positions after 200-ns simulation. Upper: Transmembrane helices from two subunits with positions 14′ (orange), 17′ (yellow), and 18′ (brown) on the proximal (gray) subunit shown as spheres. Average intrasubunit (red) and linking tunnel (purple) cavities associated with the proximal subunit were calculated using Fpocket as described in SI Methods. For clarity, only helices M2 and M3 of the distal (black) subunit are shown; in the proximal subunit, transmembrane helices M1–M4 are labeled. Lower: Equivalent view of mutant F(14′)A. (D) Average volumes across all five instances of each cavity type over the course of wild-type (black) and F(14′)A (orange) simulations. Upper: Similar pattern of intrasubunit cavities in both simulations. Lower: Larger, more variable linking tunnels in mutant F(14′)A relative to wild-type. In B and D, errors are SEM.

