Fig. 2.
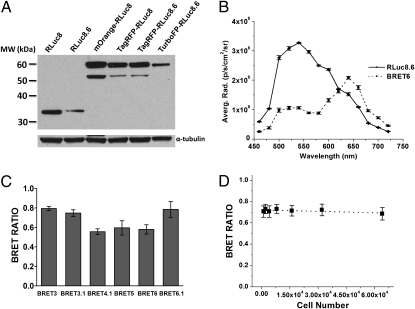
Characterization of the designed BRET systems. (A) Western blot analysis of protein expression for all BRET fusions and donor-only proteins contained in lysates of HT1080 cells stably expressing the reporter proteins. (B) Spectral imaging of HT1080 cells expressing either RLuc8.6 or BRET6 using 20-nm filers in the 460–720 nm range. EnduRen luciferase substrate was used for this experiment. Error bars = SD. (C) BRET ratios of the newly designed systems measured in cell culture. HT1080 cells (6.4 × 10⁴), stably expressing each of the BRET fusion and donor-only proteins (RLuc8 or RLuc8.6), were plated in black 96-well plates and imaged on the addition of CLZ or CLZ-v. The graph shows the average BRET ratios calculated as the A/D of the BRET system minus the A/D of donor-only cells. (D) BRET ratios calculated for the BRET6 system using various number of HT1080 cells. Experiments were performed as described in C. The dotted line represents the linear fitting for the data points. Error bars = SEM.

