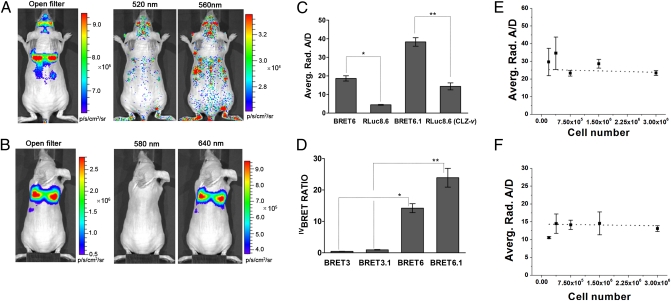
Fig. 3.
Performance of the BRET systems for deep-tissue imaging in mice. (A and B) Representative bioluminescence images of HT1080 cells stably expressing BRET fusion proteins accumulated in the lungs of nude mice. Cells (3 × 10⁶ in 150 μL PBS) were injected through the tail vein, resulting in significant trapping in the lungs. Mice were injected through the tail vein with luciferase substrate at 1.5 h after cell injection and imaged using sequentially open/donor/acceptor filters. Mice from (A) BRET3.1 (n = 10) and (B) BRET6.1 (n = 10) groups are shown. Average radiance from the thorax region was measured and used for calculating the BRET ratios. Substrate-only control mice (n = 5) were used for background subtraction. CLZ-v substrate was used. (C) Average A/Ds for BRET6, BRET6.1, RLuc8.6 (CLZ), and RLuc8.6 (CLZ-v) calculated from mice imaging experiments. *P = 3.1 × 10⁻⁹; **P = 3.5 × 10⁻¹⁰. (D) Average BRET ratios obtained from imaging of mice injected i.v. with cells expressing various BRET fusion proteins. A/D from mice injected with donor-only cells (RLuc8 or RLuc8.6) was subtracted. *P = 1.1 × 10⁻⁸; **P = 7.7 × 10⁻⁹. (E and F) Average A/Ds calculated from bioluminescence imaging of mice injected with increasing number of cells expressing either RLuc8.6 (n = 4 for each cell number) or BRET6.1 cells (n = 4 for each cell number). CLZ-v was used as substrate. The dotted line represents the linear fit for the data points. Error bars = SEM.

