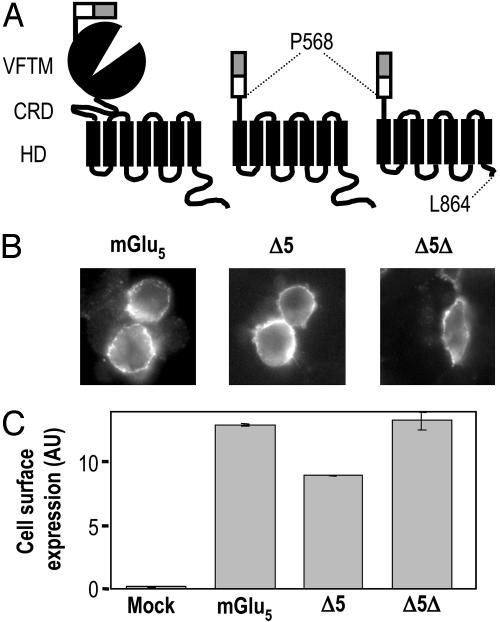
Fig. 1.
Cell surface expression of mGlu5, Δ5, and Δ5Δ. (A) Schematic representation of mGlu5, Δ5, and Δ5Δ and location of the sites of truncation. The open box represents the HA tag, and the gray box corresponds to the signal peptide of mGlu5.(B) Surface expression of mGlu5, Δ5, and Δ5Δ in HEK 293 cells was detected by immunofluorescence on nonpermeabilized cells. (C) Quantification of cell surface expression of mGlu5, Δ5, and Δ5Δ by ELISA on intact cells. Cells were transfected with 0.6, 5, and 5 μg of plasmids expressing mGlu5, Δ5, and Δ5Δ, respectively.

