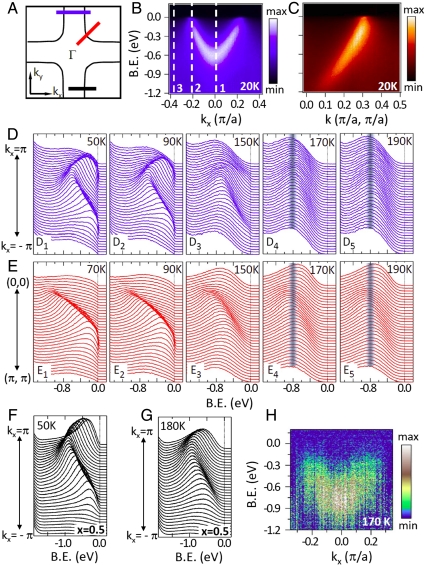
Fig. 2.
Electronic structure measurements of La2-2xSr1+2xMn2O7 (x ∼ 0.59). (A) A schematic Fermi surface plot. (B,C) Energy vs. momentum dispersive band taken at T ∼ 20 K along the blue and red cuts in box A. (D, E) Stacked EDCs from the two cuts at various temperatures. (F, G) Stacked EDCs of x = 0.5 compound, along the black cut in box A and taken at 50 K (AFM-CE state) and 180 K (PM-CE state), respectively. (H) Bloch-like dispersive band derived from box D4 by subtracting an empirical k-independent “background” represented by EDC cut 3 in box B.

