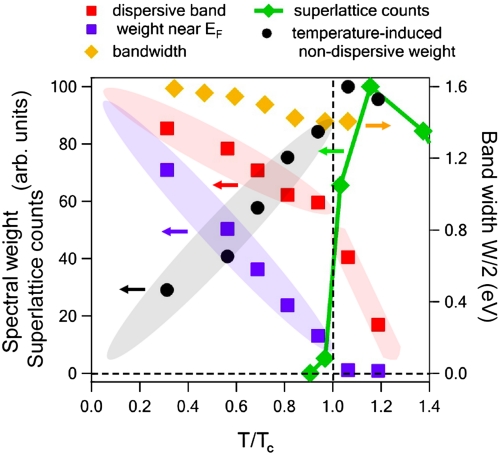
Fig. 4.
Temperature-dependent spectral weight from ARPES and superlattice counts from X-ray scattering (ref. 26) of La2-2xSr1+2xMn2O7 (x ∼ 0.59). Red and blue squares represent the total (entire occupied band) and the near-EF (-0.1 eV to +0.05 eV) spectral weight respectively. Black dots show the temperature-induced change in the nondispersive/localized weight, obtained by integrating the EDCs of Fig. 3C from -1.4 eV to -0.4 eV and scaling such that it extrapolates to zero at 0 K. All curves are scaled independently so that the change in weight can be qualitatively estimated.

