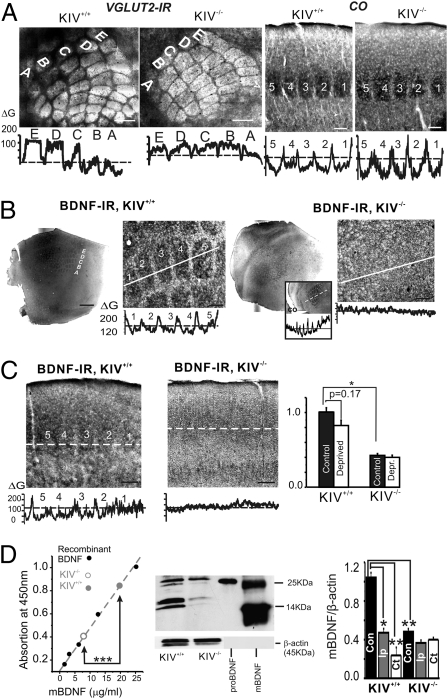
Fig. 1.
Intact barrel structure with reduced expression of BDNF in the KIV−/− mice. (A) Vglut2 IR in a tangential section (Left) and CO histochemistry in a TC section (Right) show all barrels (rows A–E) intact in KIV−/− mice. (Scale bar: 150 μm.) Bottom: Line profile of grayscale intensity of vglut2-IR and CO across different rows shows the existence of barrels (marked with numbers 1–5 or letters A–E) and septum. (B) Photograph of BDNF IR and line profile of the photo in layer IV tangential section of barrel cortex (1× and 10× magnification, respectively). The intensity of BDNF IR was measured along the white lines across the barrel field and presented in the grayscale line profiles below. The grayscale line profile clearly shows existence of the barrel pattern in the KIV+/+ but not KIV−/− mice. Inset: Barrel field in KIV−/− mice was identified via similar region in an adjacent section stained with CO, which clearly indicates the barrel field, with a line profile below. (C) Photograph of BDNF IR and line profile of the photo (Lower) in TC sections across the barrel cortex. Bar graph (Right) shows the effect of all-row whisker trimming (n = 6 mice in each group) on the differences in grayscale intensities (ΔG) of BDNF IR between barrel and septum. (D) Regulation of BDNF levels by sensory inputs. Left: BDNF absorption levels measured with BDNF Emax ImmunoAssay System (Promega). Center: Example of Western blot showing proBDNF and mBDNF in lysate from KIV+/+ and KIV−/− mice, respectively. Purified proBDNF and mBDNF are shown in right lanes for comparison. Right: Quantification of the Western blots. Lysate was obtained from freshly cut barrel cortex from KIV+/+ and KIV−/− mice (n = 3 and n = 6 mice in each group, respectively). In this and all figures, one-way ANOVA was used (*P < 0.05, **P < 0.01, and ***P < 0.001).

