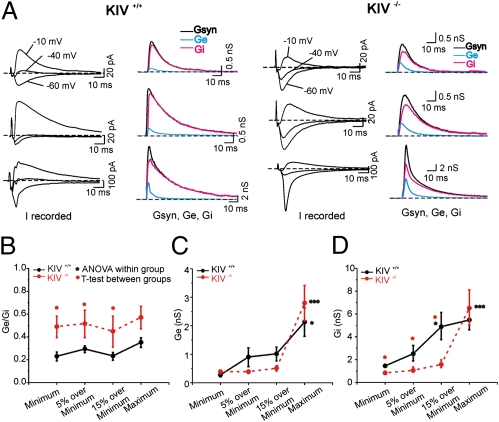
Fig. 2.
Altered E/I balance in the KIV−/− mice. (A) Actual recording of postsynaptic current (Irecorded) for each genotype recorded under voltage-clamp recording with three holding potentials (−10, −40, −60 mV; left graph for each genotype). The responses were evoked by local stimulation under three stimulation intensities: the minimum (Top), 15% over the minimum (Middle), and the maximum (Bottom). Traces were averaged from 10 consecutive sweeps. The right graph for each genotype shows continuous plot of Gsyn (black), Ge (blue), and Gi (magenta) from layer IV spiny neurons at three different stimulus conditions in the KIV+/+ and KIV−/− mice, respectively. (B–D) Mean E/I ratio (Ge/Gi) Ge, and Gi values induced by a range of stimulus conditions in KIV+/+ (black) and KIV−/− (red) mice, respectively (n = 10 neurons in each group).

