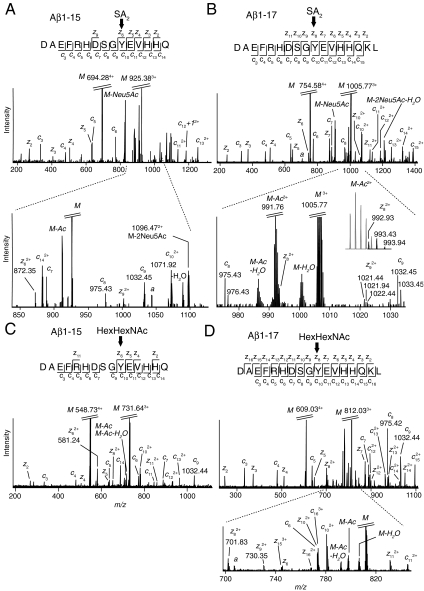
Fig. 2.
ECD MS2 fragmentation spectra of Aβ1-15 and Aβ1-17 glycopeptides. ECD spectra of (A) SA2-Aβ1-15, including an m/z expansion showing the z6, c8, and c9 fragments. (B) SA2-Aβ1-17, with an m/z expansion showing the z8 and z9 fragments. The isotopic peaks of the z8 fragment are resolved in the Inset. (C) HexHexNAc-Aβ1-15. (D) HexHexNAc-Aβ1-17 including an m/z expansion showing the z8 and z9 fragments. Parent ions (M) and the charged-reduced forms were base peaks and were cropped. Noise peaks are denoted as a. Fully m/z annotated ECD spectra and lists of c- and z-ions for all observed Tyr10 glycosylated Aβ1-X peptides are shown in SI Appendix, Fig. S4 A–K.

