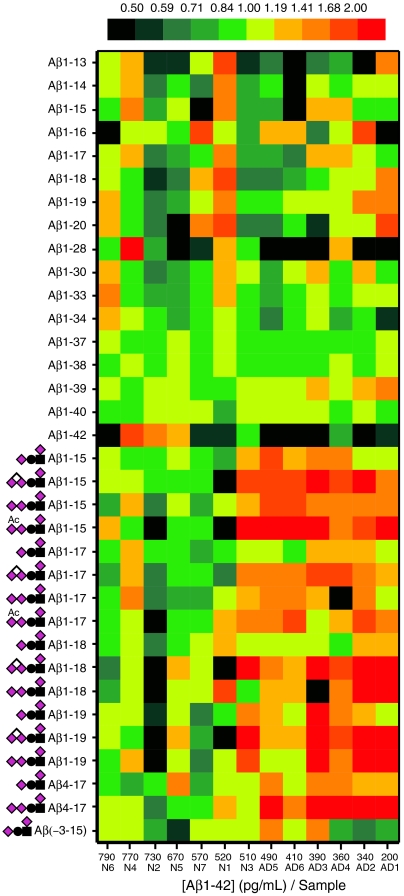
Fig. 3.
Heatmap for the relative signal intensities of individual Aβ1-X peptides and glycopeptides for Alzheimer (AD1-6) and non-Alzheimer (N1-7) patients. The samples are arranged according to their Aβ1-42 concentrations. An increase of Tyr10 glycosylated Aβ peptides for AD patients is seen as a red shift.

