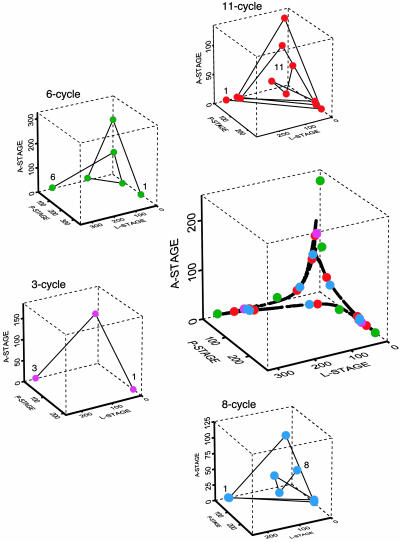
Fig. 1.
Model-predicted continuum and lattice cycles. In the central graph, all cycles that play a role in the present article are superimposed on the chaotic attractor of the deterministic model (Eq. 1). The surrounding graphs depict the four cycles individually. The 11-cycle is from the continuous-state model (Eq. 1); the 8-, 6-, and 3-cycles are from the discrete-state deterministic model (Eq. 2). The phase-space graphs were generated by using conditional least-squares parameter estimates (24).

