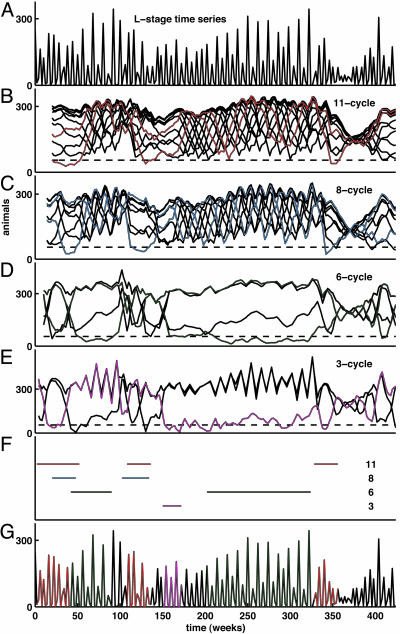
Fig. 2.
Lag metrics in the data. The LMC is defined in Appendix. (A) Raw time-series data. For clarity, only the L-stage numbers are shown. (B–F) LMC with respect to the model-predicted cycles: continuous-state model saddle 11-cycle (B); discrete-state model 8-cycle (C); discrete-state model 6-cycle (D); and discrete-state model 3-cycle (E). During intervals for which the “braid” appears tightly plaited, the data bear little or no resemblance to the corresponding model-predicted cycle. Unplaited portions of the braid correspond to intervals for which the data closely resemble the model cycle. As shown in F, we identified T-cycle episodes by setting the threshold number of animals θ = 55 (dashed line) and threshold duration K = 12 (see Appendix) for all model-predicted cycles. Thus, to be identified as a T-cycle episode in F, non-equilibrium patterns were required to be in evidence for 24 consecutive weeks (more than seven generations), a very stringent requirement. The effects of varying θ and/or K on the episodes identified can be readily seen from inspection of the LMC plots in B–E.(G) L-stage time-series data as in A, with 11-, 6-, and 3-cycle episodes identified by red, green, and magenta, respectively, corresponding to Figs. 1 and 3.

