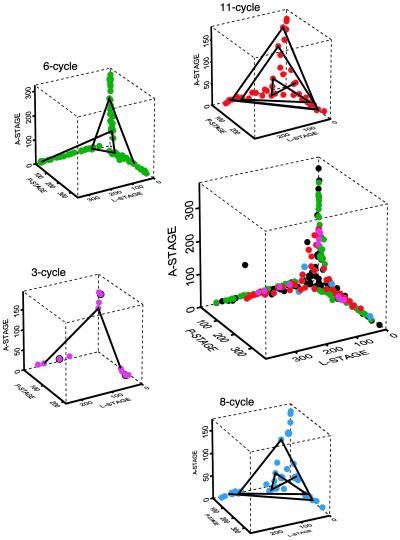
Fig. 3.
Cycle episodes in the data. The central graph is a phase-space plot of all data. Data points belonging to identified cycle episodes (see Fig. 2) are red, green, and magenta, corresponding to Figs. 1 and 2. In the surrounding graphs, data points corresponding to particular cycle episodes are isolated; some points are connected to indicate the temporal sequence. The black dots are data points not assigned to one of the model-predicted cycles.

