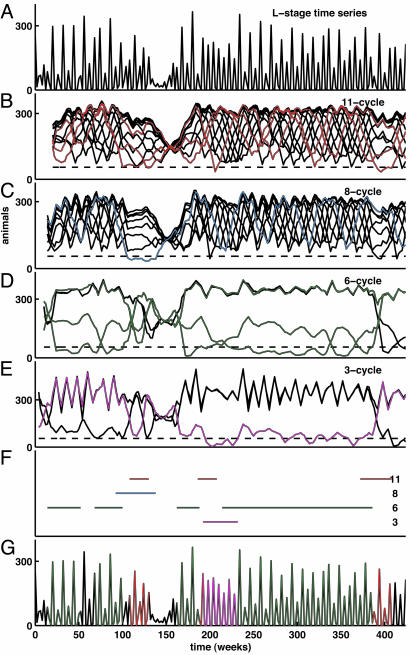
Fig. 5.
Lag metrics in a stochastic realization. The same procedure used to generate Fig. 2 has been applied to a realization of the discrete-state stochastic model (Eq. 3). (A) L-stage time-series data. (B–F) LMC with respect to the model-predicted cycles: continuous-state model saddle 11-cycle (B); discrete-state model 8-cycle (C); discrete-state model 6-cycle (D); discrete-state model 3-cycle (E); and continuous-state model unstable equilibrium (1-cycle) (F). (G) Intervals identified as cycle episodes are depicted (see Appendix for a description of the procedure we used). (H) L-stage time-series data as in A, with 11-, 6-, and 3-cycle episodes identified in red, green, and magenta corresponding to Figs. 1, 2, 3.

