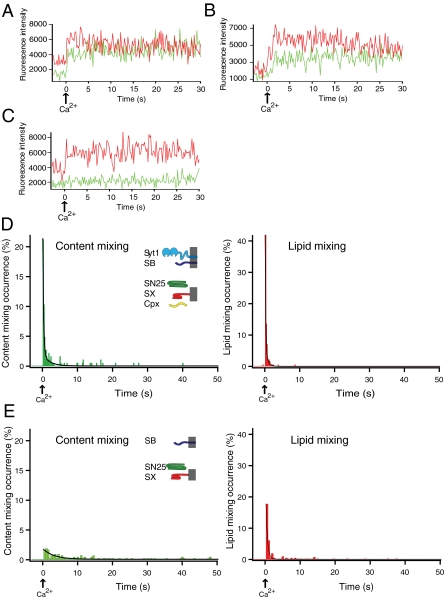
Fig. 2.
Fast Ca2+-triggered fusion kinetics. (A–C) Representative observed fluorescence intensity time traces for the full system [i.e., synaptobrevin (SB), syntaxin (SX), SNAP-25 (SN25), synaptotagmin 1 (Syt1), and complexin (Cpx)] for (A) immediate content mixing, (B) delayed content mixing, and (C) hemifusion only. Time t = 0 corresponds to the instance of 5 mM Ca2+ injection as determined by the appearance of cascade-blue fluorescence. A video showing the fluorescence of the content and lipid-mixing dyes in a field of view for one of multiple experiments is shown in Movie S1. (D) Representative histograms of the occurrence of Ca2+-triggered content- (Left) and lipid-mixing (Right) events for the full system using 200 ms time binning for one of multiple experiments (histograms were generated from n = 2357 individual traces). Events during a 3-s period before Ca2+ injection are also shown (if any). Time t = 0 corresponds to the instance of 5 mM Ca2+ injection as determined by the appearance of cascade-blue fluorescence. Histograms are normalized with respect to the number of interacting vesicles. The black lines are fits to the histograms [for content mixing, f(t) = 0.03 + 30.3 e-4.4t + 2.0 e-0.5t, and for lipid mixing, f(t) = 0.003 + 69.4 e-6.7t + 7.5 e-1.5t]. (E) Representative histograms of the occurrence of Ca2+-triggered content- (Left) and lipid-mixing (Right) events for neuronal SNAREs alone (500 ms time binning) for one of multiple experiments (histograms were generated from a total of 1,292 individual traces; n = 1292). The black lines are fits to the histograms [for content mixing, f(t) = 0.09 + 1.80 e-0.32t, and for lipid mixing, f(t) = 0.08 + 31.6 e-2.32t]. A video showing the fluorescence of the content and lipid-mixing dyes in a field of view is shown in Movie S2.

