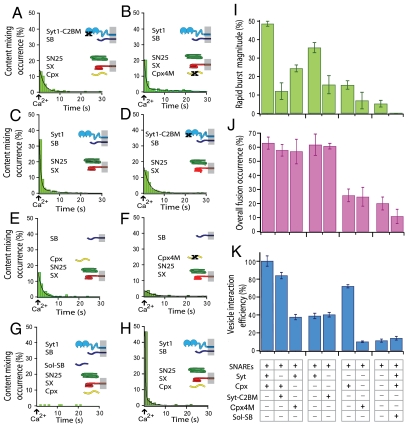
Fig. 4.
Effects on fast Ca2+-triggered fusion by manipulations of synaptotagmin 1, complexin, and SNAREs. (A) Content-mixing histogram (representative from multiple experiments, total number of traces analyzed n = 314) with SNAREs (SB, synaptobrevin; SX, syntaxin; SN25, SNAP-25), the mutant of synaptotagmin 1 (Syt1) that disrupts Ca2+ binding to the C2B domain (Syt1-C2BM), and complexin (Cpx). The black line is a fit to the histogram [f(t) = 0.37 + 17.3 e-0.49t]. (B) Representative content-mixing histogram (n = 480) with SNAREs, Syt1, and the mutant of complexin that disrupts SNARE complex binding (Cpx4M). The black line is a fit to the histogram [f(t) = 0.12 + 36.9 e-1.40t + 2.0 e-0.10t]. (C) Representative content-mixing histogram (n = 1109) with SNAREs and Syt1. The black line is a fit to the histogram [f(t) = 0.17 + 77.71 e-2.02t + 5.76 e-0.26t]. (D) Representative content-mixing histogram (n = 629) with SNAREs and the Syt1-C2BM mutant. The black lines is a fit to the histogram [f(t) = 0.21 + 19.59 e-0.42t]. (E) Representative content-mixing histogram (n = 1910) with SNAREs and Cpx. The black line is a fit to the histogram [f(t) = 0.05 + 10.50 e-0.90t + 2.27 e-0.20t]. (F) Representative content-mixing histogram (n = 508) with SNAREs and mutant Cpx4M. The black line is a fit to the histogram [f(t) = 0.15 + 3.95 e-0.28t]. (G) Content-mixing histogram (n = 168) with SNAREs, the cytoplasmic domain of synaptobrevin (Sol-SB), Syt1, and Cpx. The cytoplasmic domain of synaptobrevin was incubated with acceptor vesicles prior to adding donor vesicles, greatly reducing trans SNARE complex formation. (H) Representative content-mixing diagram (n = 778) for the full system with wild-type proteins, similar to Fig. 2D, Left, except for a 0.5-s exposure time for each image and 1-s binning for calculating the content-mixing histogram. The black line is a fit to the histogram [f(t) = 0.07 + 294.34 e-3.94t + 7.03 e-0.41t]. The time constants obtained from this fit are close to those for the fit to the histogram with 200-ms binning (Fig. 2D, Left) (they are within experimental error obtained from multiple experiments). All content-mixing histograms were normalized with respect to the number of interacting vesicles. Histograms are only shown for the first 30 s because few events occurred after this period; very few, if any events occurred in the few seconds before Ca2+ triggering. Time t = 0 corresponds to the instance of Ca2+ injection as determined by the appearance of cascade-blue fluorescence. The time bin of the histograms is 1 s. Corresponding lipid-mixing histograms are shown in Fig. S8. (I) Bar graph of the rapid burst magnitude for the experiments (time bin = 1 s). (J) Bar graph of the overall fusion occurrence. (K) Bar graph of the vesicle interaction efficiency (see Materials and Methods for definition of the rapid burst magnitude, overall fusion occurrence, and vesicle interaction efficiency). Means and error bars (standard deviations) were obtained from multiple experiments.

