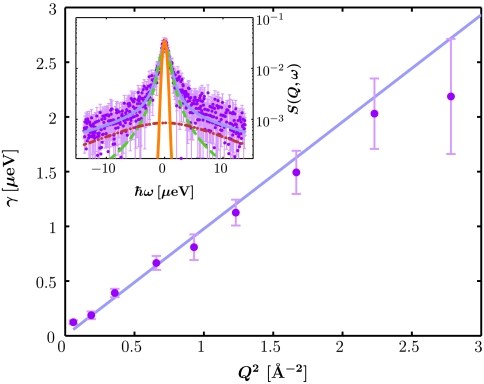
Fig. 2.
Inset: Example backscattering spectrum S(Q,ω) (symbols) recorded at IN16 for BSA in D2O (c = 500 mg/mL, φ = 28.5%, T = 300 K, individual detector at Q = 0.81 Å-1). The magenta solid line is the fit of the model from Eq. 3. The two Lorentzians in Eq. 3 are indicated by the dashed and dash-dotted lines. The orange solid line denotes the resolution function. Main figure: Fitted γ (symbols) vs. Q2 for the full Q-range of the example data. The fit of γ = D Q2 (blue line) is consistent with simple diffusive behavior. For statistical reasons the fit range is restricted to Q2 < 1.5 Å-2.

