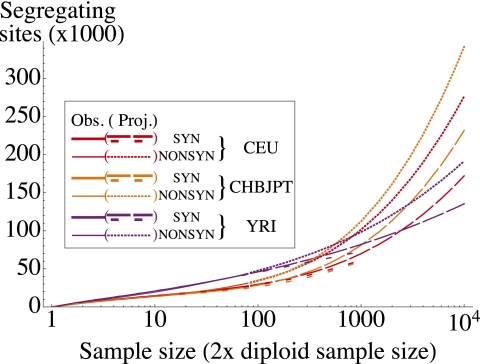
Fig. 5.
Observed and projected numbers of synonymous and nonsynonymous variants in CEU, CHB + JPT, and YRI as a function of the sample size (two times the number of individuals sequenced). Long and short dashes correspond to jackknife and model-based projections for synonymous sites, respectively. The dotted lines are jackknife projections for nonsynonymous sites. Discrepancies between projections are accounted for by the difference between the model prediction and observed number of singletons in the data.

