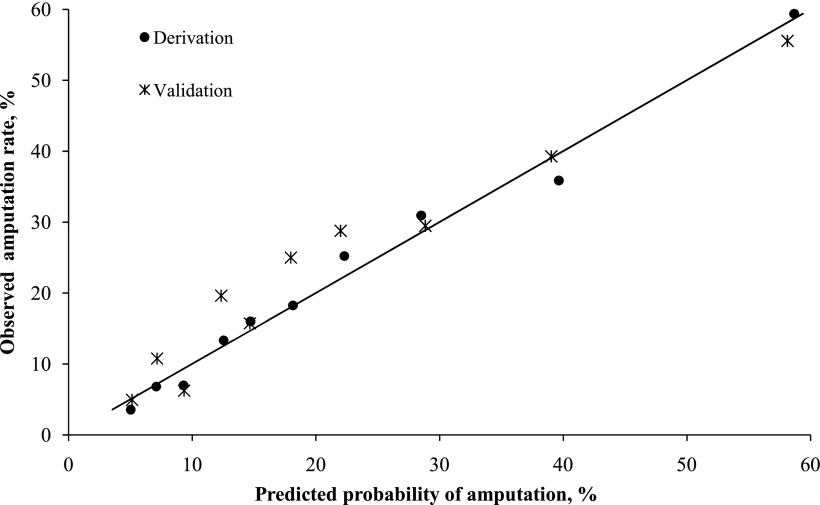
Figure 1.
Comparison of the predicted probability of LEA against the observed amputation rate for both derivation and validation cohorts, by decile. The diagonal line represents perfect correlation of predicted and observed LEA rates. Model Hosmer-Lemeshow goodness-of-fit test χ2 = 6.2, P = 0.63 vs. χ2 = 9.2, P = 0.33 for the derivation vs. the validation cohorts, indicating excellent fit of the model.

