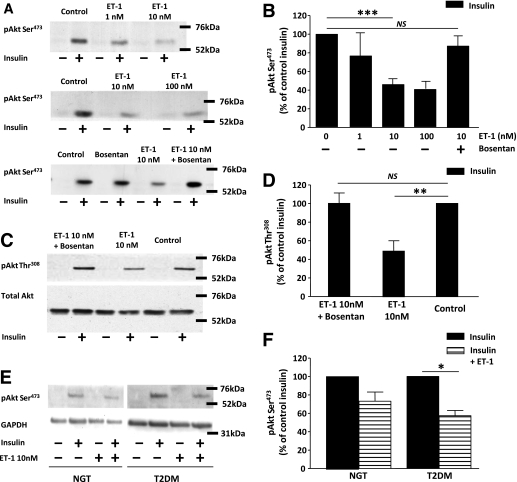
FIG. 5.
A and B: Basal and insulin-stimulated expression of phosphorylated Akt at the Ser473 site, under control conditions and after a 1-h exposure to ET-1 (1, 10, and 100 nmol/L) in the absence and presence of the ET receptor antagonist bosentan (3 μmol/L). ***P < 0.001. NS, not significant by Wilcoxon test. Data are means ± SEM (n = 4–19). C and D: Basal and insulin-stimulated expression of phosphorylated Akt at the Thr308 site in the absence and presence of the ET receptor antagonist bosentan (3 μmol/L). Total Akt expression was used as a loading control (n = 8). **P < 0.01 by Wilcoxon test. Data are means ± SEM (n = 7). E and F: Insulin-stimulated expression of phosphorylated Akt under control conditions and after a 1-h exposure to ET-1 (10 nmol/L) in cells established from subjects with NGT (n = 5) and subjects with type 2 diabetes (T2DM) (n = 4). Total expression of glyceraldehyde-3-phosphate dehydrogenase (GAPDH) was used as a loading control. *P < 0.05 by one-sample t test. Data are means ± SEM.

