FIG. 6.
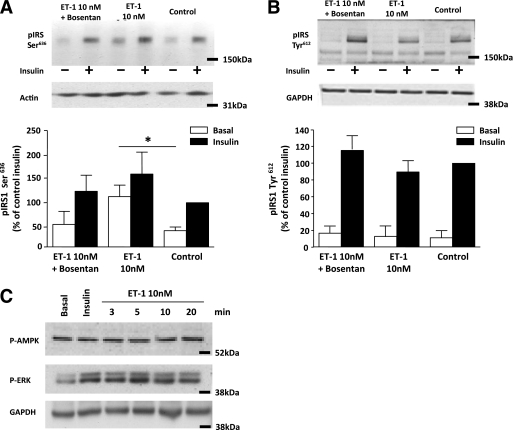
A: Basal and insulin-stimulated expression of phosphorylated IRS-1 at the Ser636 site, under control conditions and after a 1-h exposure to ET-1 in the absence and presence of the ET receptor antagonist bosentan (3 μmol/L). *P < 0.05 by Mann-Whitney U test. Data are means ± SEM (n = 10). B: Basal and insulin-stimulated expression of phosphorylated IRS-1 at the Tyr612 site, under control conditions and after a 1-h exposure to ET-1 in the absence and presence of the ET receptor antagonist bosentan (3 μmol/L). Data are means ± SEM (n = 8). C: Phosphorylation of ERK1/2 and AMPK under control conditions and 3, 5, 10, and 20 min of ET-1 (10 nmol/L) treatment. Total expression of actin and glyceraldehyde-3-phosphate dehydrogenase (GAPDH) was used as a loading control.

