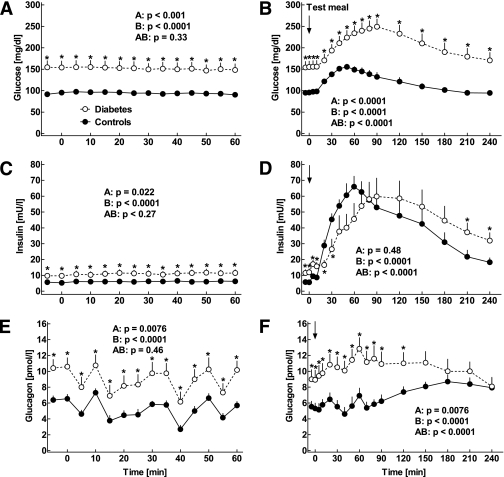
FIG. 1.
Plasma concentrations of glucose (A and B), insulin (C and D), and glucagon (E and F) in 12 patients with type 2 diabetes (open symbols) and 13 nondiabetic control subjects (filled symbols) studied in the fasting state (A, C, and E) as well as after mixed meal ingestion (B, D, and F). Arrows indicate the time of meal ingestion. Data are presented as means ± SEM. Statistics were carried out using repeated-measures ANOVA and denote (A) differences between the groups, (B) differences over the time course, and (AB) differences due to the interaction of group and time. Asterisks indicate significant differences at individual time points (P < 0.05).

