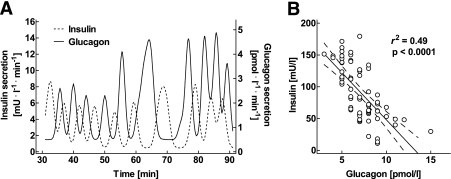
FIG. 4.
A: Individual postprandial secretion rates of insulin (left y-axis) and glucagon (right y-axis), derived from deconvolution analysis, in a representative nondiabetic control subject. B: The corresponding linear regression analysis between the minutely sampled postprandial concentrations of insulin and glucagon in the same individual.

