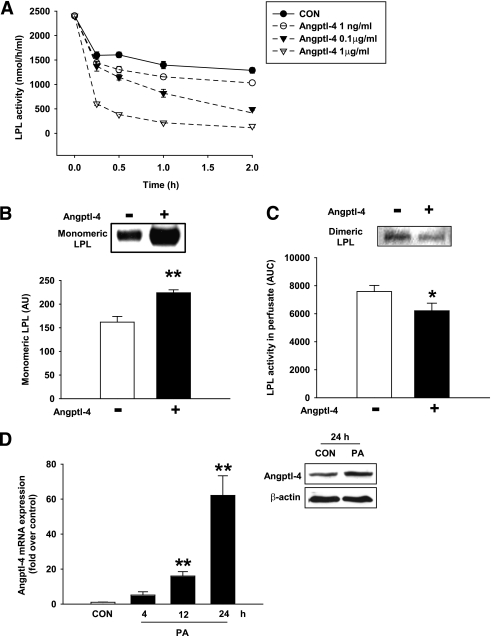
FIG. 6.
Angptl-4, which reduces LPL activity, is upregulated by FA. Hearts from D55 animals were perfused with heparin to release LPL at the vascular lumen. Fractions with peak LPL activity were then incubated with purified human Angptl-4 at a final concentration of 1 ng/mL, 0.1 μg/mL, and 1 μg/mL. Reaction mix was incubated at 37°C and LPL activity at the indicated times was determined (A). Results are the mean ± SE from three repeated experiments. Hearts from D55 animals were also directly perfused with or without 1 ng/mL purified Angptl-4 for 1 h. Perfusion buffer was collected at the end of this period. Monomeric LPL released into the perfusates was isolated by collecting the 0.75 mol/L fractions from the heparin–sepharose column and quantified by Western blot (B). After Angptl-4 perfusion, hearts were subsequently perfused with 5 units/mL heparin to release LPL activity remaining at the vascular lumen. LPL activity in the perfusate is expressed as area under curve over the 3-min perfusion (C). These perfusates over 3 min were pooled and loaded onto a heparin–sepharose column to visualize dimeric LPL in the 1.0 mol/L fractions (C, inset). Results are the mean ± SE of three animals in each group. Isolated cardiomyocytes were incubated with 1.0 mmol/L PA for 4, 12, or 24 h. mRNA expression of Angptl-4 was quantified by real-time PCR and compared with control (CON) treated with 1% BSA (D). Protein expression of Angptl-4 after 24-h incubation with PA is illustrated in the inset. Results are the mean ± SE of five repeated experiments using different animals. *Significantly different from control, P < 0.05. **Significantly different from control, P < 0.01. AU, arbitrary units; AUC, area under curve.

