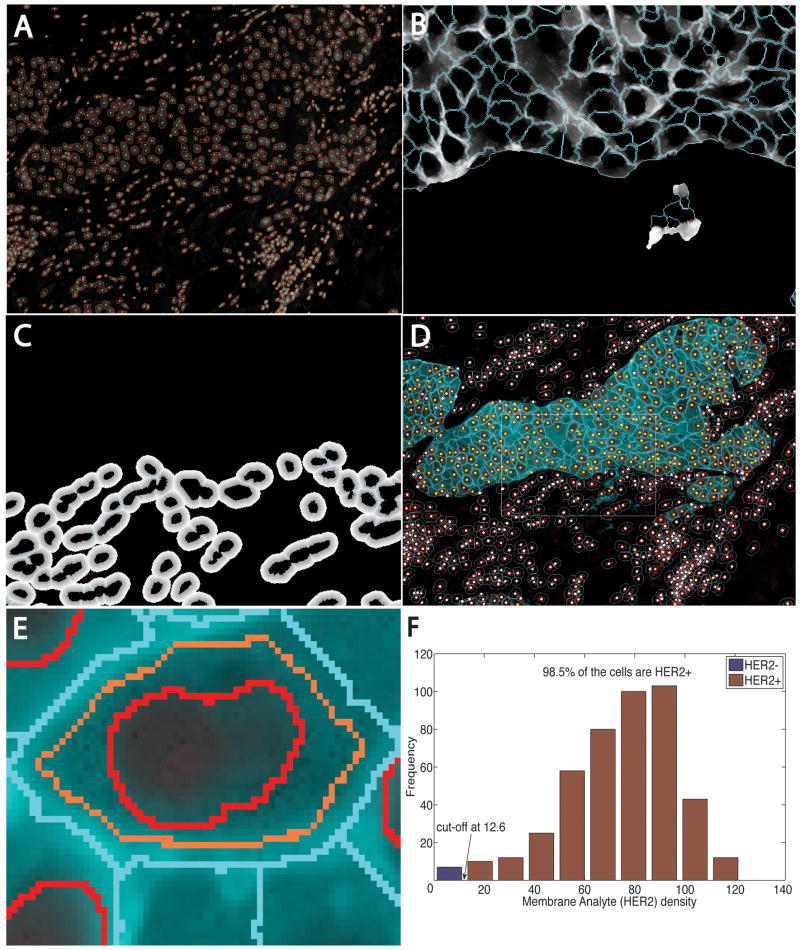
Figure 2.
Automated image analysis steps for the specimen in Figure 1. A, Automatic nuclear segmentation (red outlines) of the nuclear channel. B, Estimated cytoplasmic domains for cytokeratin-positive cells for the boxed region in D overlaid on the gradient-enhanced distance map (Mode 0). C, Geometrically estimated cytoplasmic domains for stromal cells in the same region overlaid on the underlying dominance map (Mode 1). D, Composite cell segmentation and classification results, with yellow dots indicating cells that are cytokeratin-positive and HER2-positive, and white dots indicating other cells. E, Close-up illustrating regions of interest used to quantify HER2. F, Histogram summary showing the cut-off point for declaring cells HER2-positive.

