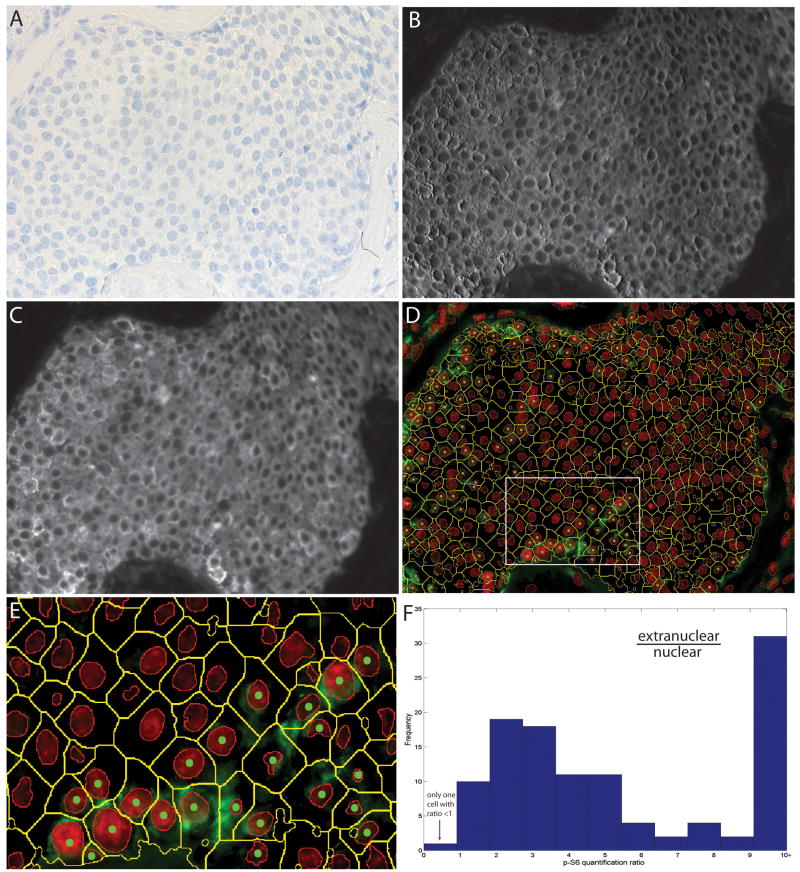
Figure 6.
Analysis of phospho-S6 immunostaining in a human breast cancer. A section of a breast tumour was stained with anti-p-S6 (Alexa-488), anti-epithelial membrane antigen (EMA) (Alexa-594) and anti-cytokeratin (CK) (Alexa-555), and this was followed by haematoxylin staining, multispectral imaging (×400), and cytometric analysis. The brightfield image is shown (A), along with unmixed channels for Alexa-555 (CK) (B) and Alexa-594 (EMA) (C). Composite images of p-S6 analyte staining along with segmented whole tumour cells are shown (D; E shows an enlargement of the boxed area in D). In each cell, analyte in the nuclear and extranuclear compartment was quantified. Extranuclear/nuclear analyte ratios were calculated for each positive tumour cell, and their distribution is shown (F).

