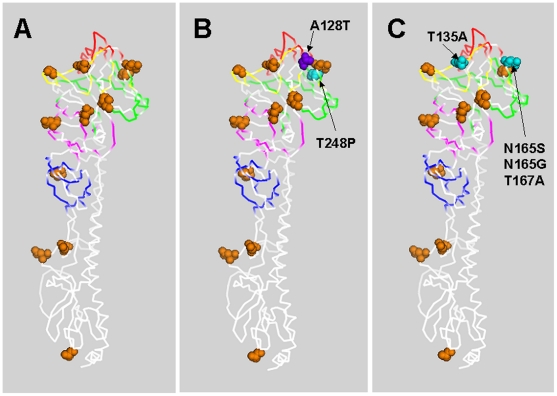
Figure 4. Analysis of Glycosylations.
Space-filled model of HA ectodomain from related H3N2 strain X31 drawn with PyMOL using 2VIR.pdb [19]. Panel A shows the H3N2 glycosylation sites of the wild type Wyoming/2003, Panel B shows glycosylation site changes in the naïve Guinea pigs, and Panel C shows glycosylation site changes in the immunized Guinea pigs. Epitopes A, B, C, D, E are shown colorized in yellow, red, blue, green and pink, respectively. Receptor binding site is shown as mesh. Residues at which glycosylation sites were either lost during the evolution of the virus in Guinea pigs are shown in cyan, or sites that were added in purple.

