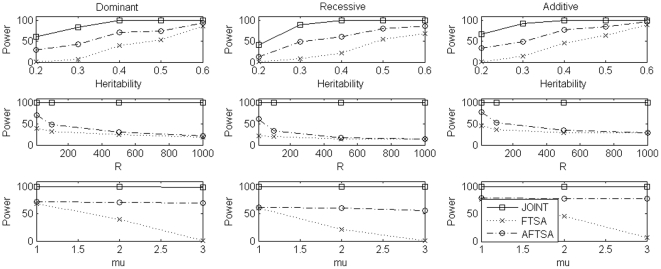
Figure 2. Power comparison under simulation set 2 when sample size is 600 trios.
In the first row, we compare power of the three methods for different values of heritability under the three disease models while μ = 2 and the number of markers selected at the first stage is 10. In the second row, we compare power of the three methods for different numbers of markers selected at the first stage under the three disease models while μ = 2 and heritability is 0.05. In the third row, we compare power of the three methods for different values of μ under the three disease models while heritability is 0.05 and the number of markers selected at the first stage is 10. In each case, we use 800 genomic markers to control for population stratification in the admixture screening test.

